 NERC Data Catalogue Service
University of Hull
Type of resources
Topics
Keywords
Contact for the resource
Provided by
Years
Formats
Representation types
Update frequencies
Resolution
-
The emission of carbon dioxide into the atmosphere has caused huge concerns around the world, in particular because it is widely believed that the increase in its concentration in the atmosphere is a key driver of climate change. If the current trend in the release of carbon dioxide continues, global temperatures are predicted to increase by more than 4 degrees centigrade, which would be disastrous for the world. With the increase in world population, the energy demand is also increasing. Coal-fired and gas-fired power plants still play a central role in meeting this energy demand for the foreseeable future, even though the share of renewable energy is increasing. These power plants are the largest stationary sources of carbon dioxide. Carbon capture is a technique to capture the carbon dioxide that is emitted in the flue gas from these power plants. This proposal seeks to make a significant improvement in the methods used for carbon capture in order to reduce the total costs. Post-combustion CO2 capture by chemical absorption using solvents (for example, monoethanolamine - MEA) is one of the most mature technologies. The conventional technology uses large packed columns. The cost to build and run the capture plants for power plants is currently very high because: (1) the packed columns are very large in size; (2) the amount of steam consumed to regenerate solvents for recirculation is significant. If we can manage to reduce the size of packed columns and the steam consumption, then the cost of carbon capture will be reduced correspondingly. From our previous studies, we found that mass transfer in the conventional packed columns used for carbon capture is very poor. This proposed research is expected to make very significant improvements in mass transfer. The key idea is to rotate the packed column so that it spins at hundreds of times per minute - a so-called rotating packed bed (RPB). A better mass transfer will be generated inside the RPB due to higher contact area. With an intensified capture process, a higher concentration of solvent can be used (for example 70 wt% MEA) and the quantity of recirculating solvent between intensified absorber and stripper will be reduced to around 40%. Our initial analysis has been published in an international leading journal and it indicates that the packing volume in an RPB will be less than 10% of an equivalent conventional packed column. This proposal will investigate how to design and operate the RPB in order to separate carbon dioxide most efficiently from flue gas. The work will include design of new experimental rigs, experimental study, process modelling and simulation, system integration, scale-up of intensified absorber and stripper, process optimisation, comparison between intensified capture process and conventional capture process from technical, economical and environmental points of view. The research will include an investigation into the optimum flow directions for the solvent and flue gas stream (parallel flow or counter-current) for intensified absorber and the optimum design of packing inside the RPB. The proposal will also compare the whole system performance using process intensification vs using conventional packed column for a CCGT power plant. Based on this, an economic analysis will be carried out to quantify the savings provided by this new process intensification technology. Grant number: EP/M001458/1.
-

This presentation on the EPSRC project, Process Intensification for Post-combustion Carbon Capture using Rotating Packed Bed through Systems Engineering Techniques, was presented at the Cranfield Biannual, 21.04.15. Grant number: EP/M001458/1.
-
This dataset describes hourly time series of discharge and suspended sediment flux at four sites in the Vietnamese Mekong Delta (Chau Doc, Tan Chau, Can Tho and My Thaun) for the period 2005 – 2015. This data was calculated from historic Acoustic Doppler Current Profiler (aDcp)data obtained as part of routine flood monitoring conducted by the Vietnamese Hydrological Agency. The data were collated by the authors. The data were processed to back out sediment fluxes through the delta through calibration of the acoustic backscatter signal to suspended sediment concentrations collected in Chau Doc (May 2017) and Can Tho (September 2017). For each aDcp instrument acoustic backscatter signal was calibrated to observed suspended sediment concentrations (SSCs). These concentrations values were then matched to measured acoustic backscatter values (dB) from the depth at which each sample was taken to generate power law calibration curves. To generate daily fluxes, the point specific ADCP fluxes were used to generate sediment ratings curves between sediment flux (kg/s) and discharge (m3/s). These ratings curves were then propagated over recorded daily discharge values measured by the Vietnamese hydrological agency to provide daily fluxes over the period of record. The work was funded through NERC grant reference NE/P008100/1 - Deciphering the dominant drivers of contemporary relative sea-level change: Analysing sediment deposition and subsidence in a vulnerable mega-delta. Full details about this dataset can be found at https://doi.org/10.5285/ac5b28ca-e087-4aec-974a-5a9f84b06595
-

These files contain Electric Resistivity Ground Imaging (ERGI) data measured using a Tigre 128 electric resistivity system with 64 electrodes in a roll-along survey mode. The electrodes were spaced 5 m apart and used in a Wenner a array configuration. The format of the file names is as follows: The two digits following B (18 or 20) is a label indicating the measurement site The digit following the T (1, 2 or 3) is the measurement transect number The next six digits, following the underscore, are the measurement date (ddmmyy) The next two digits, following the second underscore, are the survey number (measurements were repeated multiple times) The files are in tab delimited ascii text format, with three columns of data: Column 1 contains the distance measured across the survey transect Column 2 contains the a-spacing (the distance between adjacent electrode pairs) in m Column 3 contains the measured apparent resistivity value in Ohm m
-

Field and microstructural analysis of pseudotachylytes formed at lower crustal depths and now lying exposed in the Flakstadøy Anorthosite, Lofoten, Norway. Electron backscatter diffraction (EBSD) analysis : 10 EBSD datasets (cpr files) - unfiltered. These characterise deformation in pyroxenes spatially associated with pseudotachylyte faults in the Nusfjord anorthosite. Grain size analysis - backscattered electron (BSE) images and processed equivalents (segmented manually or with ImageJ software) of fragmented orthopyroxene for grain size analysis. Results are processed in the spreadsheet 'Grain size distributions for fragmented OPX'. Samples involved: LC1724 and N22 Grain growth modelling - spreadsheet calculating grain growth rates for orthopyroxene in samples LC1724 and N22 Strain analysis - used to estimate strain via clast analysis of mylonitised pseudotachylyte, sample 269c
-
This dataset includes raw point cloud data from repeat terrestrial laser scans (TLS) of rippled surfaces on barchan and dome dunes within the Huab Dune Field, Skeleton Coast National Park, Namibia. This raw data can be used to extract saltation height dynamics as well as 3D ripple data including celerity. As well as the TLS data, additional measurements of the wind speed through a CSAT 3D sonic anemometer or cup anemometer and sediment transport using a Sensit and Wenglor gate sensor.
-
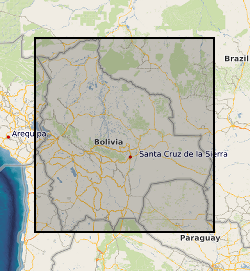
Each file contains four columns of data representing: column 1: UTM Zone 19S Easting coordinate for survey location along the Rio Beni, Bolivia. column 2: UTM Zone 19S Northing coordinate for survey location along the Rio Beni, Bolivia. column 3: Measurment range from observer to bank in m column 4: Bank height in m (the difference between bank top and low flow water level) UTM coordinates were measured using a Trimble Global Position System with OmniSTAR HP correction Measurement range and bank height were measured using a GPS supported laser range finder (Impulse 200 LR< Laser Technology inc) Survey 1 was carried out between 15th and 19th September 2011, when the flow discharge within the Beni was in the range 453-530 cumecs Survey 2 was carried out between 20th and 23rd September 2011, when the flow discharge within the Beni was in the range 762-892 cumecs
-
Records of leaf damage caused by and parasitism of Cameraria ohridella in Britain in 2010 collected with a citizen science approach as part of the Conker Tree Science citizen science project, plus validation of the data. Over 3500 people in Great Britain provided data at a national scale on an invasive insect (horse-chestnut leaf-mining moth, Cameraria ohridella Deschka & Dimic; Lepidoptera: Gracillariidae) in order to address two hypotheses. Specifically: (1) whether the levels of damage caused to leaves of the horse-chestnut tree, Aesculus hippocastanum L., and (2) whether the level of parasitism of C. ohridella larvae were both greatest where C. ohridella had been present the longest Participants recorded leaf damage on an ordinal scale (0-4) during the summer (1st July to 15th October 2010). In order to assess the levels of parasitism of caterpillars of C. orhidella, we invited people to rear insects from horse chestnut leaves infested with C. ohridella. Participants sampled leaves during the first week of July 2010 (i.e. the first of the moth's gererations that year) and stored them in sealed plastic bags for two weeks. We then asked participants to report the number of leaf-mines, and to identify and count the insects in each category: adult C. ohridella moths, parasitoids, and other insects. Anyone could take part in rearing parasitoids, but we particularly focused on school children aged 8-11 by working with a team of eight trained volunteers across the country who directly contacted schools and led lessons in classes. The volunteers did not provide directive guidance during the time that the children were counting adult moths and parasitoids, so the data were not biased by our supervision. At the completion of the activity, we retained a randomly-selected subset of 669 samples that the children had counted. We also retained an additional 75 samples in which children had reported parasitoids. For all of these samples an expert blindly assessed the counts of leaf mines, adult C. ohridella moths and other insects. In order to assess how many years that C. orhidella had been present in a location, we used a long-term dataset collated by Forest Research (used with permission). These data showed under-sampling of the range of C. orhidella after 2006, so we also modeled the predicted arrival of C. orhidella based on a demographic model of spread parameterised in continental Europe by augementing the known distribution with a model of short-distance spread by the model. We ran the model twice, assuming two and three generations of C. ohridella, respectively. The project was supported by the Natural Environment Research Council and undertaken at the University of Bristol, UK. Full details about this dataset can be found at https://doi.org/10.5285/9f913f10-6e3d-449e-b8af-8fa2d06d7fd3
-

Each contains two columns of data representing the UTM coordinates of the centre line of the Rio Beni in Bolivia. These coordinates were derived by digitising Landsat imagery and aerial photographs (1960 only). The number in the file name after "banks_c" corresponds to the year. Numbers in column 1: UTM Zone 19S Easting Numbers in column 2: UTM Zone 19S Northing
-
These data are input files for CAESAR-Lisflood (CL), a numerical hydrodynamic-landscape evolution model. These files were created to support coupled hydrodynamic-landscape evolution modelling to evaluate the geomorphological response of river channels affected by the 7th February 2021 ice-rock avalanche and debris flow in Chamoli District, Uttarakhand, India. They include 10 m digital elevation models (DEMs) of bed rock and land surface topography in a gridded (raster) format. They also include reanalysis-derived river discharge data generated by the GEOGloWS project at the following locations: Rontigad, Rishiganga, Dhauliganga, and Alaknanda. The configuration settings and parameters for CL modelling are also included. Full details about this dataset can be found at https://doi.org/10.5285/4cdd86b3-bf58-457d-b8cf-b57aed2d56d0